Cortando de perto: Notas de um engenheiro de campo sobre projeto de revestimento com fenda e controle de areia
Você sabe o que me mantém acordado à noite? Não são as explosões. Não são os dias de alta pressão. É a areia. Multar, nojento, areia de formação rastejando através de uma tela, comendo bombas, enchimento de separadores, transformando poços de milhões de dólares em poços de dinheiro. Vinte e cinco anos neste negócio, e já vi mais poços falharem devido à produção de areia do que por qualquer outra causa.
Deixe-me contar sobre um trabalho no Golfo da Tailândia, de volta ’09. Estávamos completando um poço de gás, arenito não consolidado, sobre 3000 metros de profundidade. A especificação pedia telas enroladas em fio. Coisas padrão. Mas o vendedor estava atrasado, a plataforma estava esperando, e a operadora estava perdendo $200,000 um dia. Então o homem da empresa olha para mim e diz, “Podemos executar forros com fenda?”
eu disse não. Ele os comandou de qualquer maneira.
Três meses depois, Estou de volta àquelas telas de pesca falhadas. As ranhuras foram erodidas até o dobro da largura original. A formação se transformou em cascalho no anel. O poço estava fazendo 40% corte de areia. Um desastre completo.
Foi quando eu aprendi: forro com fenda design não é algo que você adivinha. É algo que você calcula, teste, e verifique. Ou você paga o preço.
O problema: Por que o controle de areia é importante
Aqui está a física disso. Você faz um furo em uma formação de arenito não consolidado. A rocha ao redor daquele buraco está estressada. Remova a pedra, substitua-o por fluido, e que o estresse redistribui. A formação quer falhar. Ele quer derramar areia no seu poço.
Fórmula 1: Pressão Crítica de Rebaixamento
Onde:
-
= Pressão crítica de rebaixamento (psi)
-
= Tensão horizontal efetiva (psi)
-
= Ângulo de falha (graus)
-
= Ângulo de fricção (graus)
Exceder este número, e sua formação começa a produzir areia. Simples assim.
Mas aqui está o que a maioria dos livros didáticos não conta: essa fórmula assume uma mecânica de rocha perfeita. No mundo real, sua formação tem listras, laminações, e heterogeneidades. O rebaixamento crítico pode ser 1500 psi em uma zona e 300 psi a dez metros de distância. Você não sabe até perfurar.
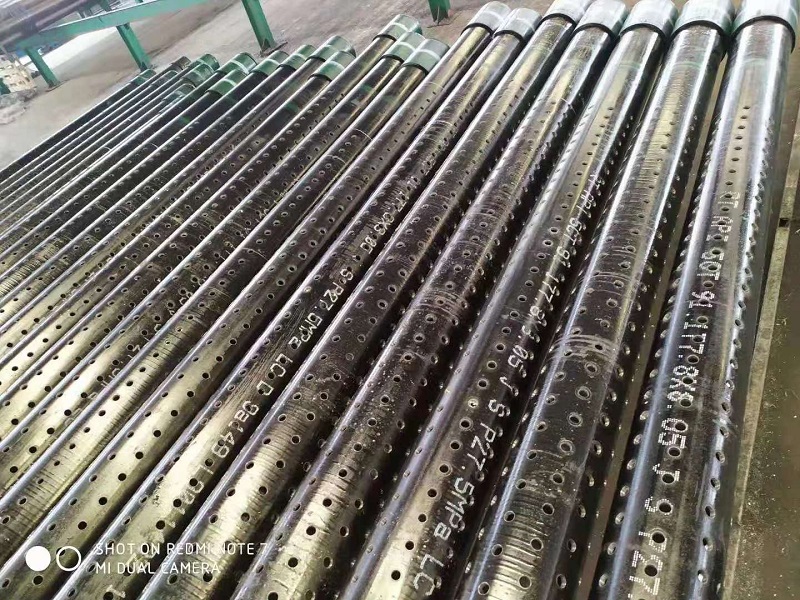
Então você instala controle de areia. E forros com fenda? Eles são o truque mais antigo do livro. Barato, simples, sem partes móveis. Mas projetá-los errado, e eles são inúteis.
Design de caça-níqueis: O diabo nos detalhes
Eu estava trabalhando na Bacia do Permiano no ano passado. Poço horizontal, 4000 pés laterais, Formação Wolfcamp. A operadora queria economizar dinheiro. Quem não? Eles propuseram slots de 0,25 mm, 120 slots por metro, padrão em espiral. Parecia razoável no papel.
Mas eu olhei para a análise da peneira dos núcleos das paredes laterais. D10 foi 180 mícrons. D50 foi 220 mícrons. D90 foi 320 mícrons.
Fórmula 2: Seleção de largura do slot (Minha regra prática)
Isso é conservador. Alguns operadores usam 2.5 ou mesmo 3 vezes D10. Mas já vi muitos poços plugados em slots mais largos. Arcos de areia precisam se formar na abertura do slot. Muito largo, e o arco desmorona. Muito estreito, e você restringe o fluxo.
Para isso bem:
(0.36milímetros)
Eles queriam 0,25mm. Quarenta por cento muito estreito.
eu argumentei. Eles empurraram de volta. Eventualmente nós nos comprometemos: 0.30ranhuras mm no calcanhar, 0.35mm no dedo do pé. Por que a diferença? Porque a velocidade do fluxo é maior no calcanhar. Maior velocidade significa maior risco de erosão. Slots mais apertados em zonas de alta velocidade proporcionam um fator de segurança.
Seis meses depois, Eu verifiquei novamente. As seções de 0,30 mm estavam limpas. As seções de 0,35 mm apresentavam pequenos entupimentos, mas ainda fluíam. O operador aprendeu algo. Eu também.
Mesa 1: Diretrizes para seleção de largura de slot (Com base no tamanho da areia de formação)
| Tipo de formação | Faixa D10 (mícrons) | Largura recomendada do slot (mícrons) | Largura do slot (Polegadas) | Aplicação Típica |
|---|---|---|---|---|
| Areia Muito Fina | 50-100 | 100-200 | 0.004-0.008 | Águas profundas do Golfo do México |
| Areia Fina | 100-150 | 200-300 | 0.008-0.012 | Poços de gás no Mar do Norte |
| Areia Média | 150-250 | 300-500 | 0.012-0.020 | Óleo da Bacia Permiana |
| Areia Grossa | 250-350 | 500-700 | 0.020-0.028 | Carbonatos do Oriente Médio |
| Cascalho | >350 | 700-1000 | 0.028-0.040 | Óleo pesado, Canadá |
Observação: Estes são pontos de partida. Sempre execute um cálculo de ponte e testes de laboratório, se possível.
O problema da geometria: Não é apenas largura
Aqui está algo que os livros didáticos encobrem: a geometria do slot é tão importante quanto a largura. Aprendi isso da maneira mais difícil em um trabalho no Mar do Norte, 2012. Tínhamos lindos slots cortados a laser de 0,30 mm, tolerâncias perfeitas, padrão em espiral. O poço foi lixado em três semanas.
O que aconteceu?
Nós puxamos o forro. Sob microscópio, os slots mostraram algo interessante. As bordas eram afiadas. Corte a laser, você vê, cria uma zona afetada pelo calor. O metal fica duro, frágil. E quando a areia atinge uma ponta afiada 50 metros por segundo, corta como um jato de água. As ranhuras sofreram erosão de 0,30 mm para 0,45 mm no lado da entrada. Areia correu.
A solução? Bordas de entrada arredondadas. Parece contra-intuitivo, certo? Mas aqui está a física: uma borda arredondada desvia os grãos de areia. Uma borda afiada os divide. A borda arredondada cria uma camada limite fluida que mantém a areia longe do metal. Mudamos para ranhuras EDM cortadas a fio com raio de 0,05 mm na borda de entrada. O mesmo bem, forro diferente, produção zero de areia por dois anos.
Densidade de Slot: Quantos são suficientes?
Eu recebo essa pergunta o tempo todo de jovens engenheiros. “Devo maximizar a área aberta?” E eu sempre respondo da mesma maneira: depende.
Fórmula 3: Porcentagem de área aberta
Onde:
-
= Porcentagem de área aberta
-
= Número de slots
-
= Largura do slot (milímetros)
-
= Comprimento do slot (milímetros)
-
= Diâmetro do revestimento (milímetros)
-
= Altura/espaçamento do slot (milímetros)
Matemática simples. Mas aqui está o problema: mais slots significa menos metal entre os slots. Menos metal significa menor resistência ao colapso. Em um cenário de rebaixamento de alta pressão, você pode literalmente apertar seu forro como uma lata de refrigerante.
Eu vi isso no Golfo do México, 2015. Poço em águas profundas, 10,000 pressão do reservatório psi, 5000 redução psi. A operadora queria o máximo desempenho de entrada. Eles especificaram 200 slots por metro, 0.50mm largura, 50mm comprimento. Área aberta: 8.5%.
O revestimento entrou em colapso durante o segundo período de fluxo. A análise de elementos finitos mostrou posteriormente que os ligamentos entre fendas produziram em 4500 diferencial em psi. A classificação de pressão de colapso foi metade do que eles presumiram.
Mesa 2: Redução da pressão de colapso vs.. Densidade de Slot
| Slots por Metro | Área aberta (%) | Redução da pressão de colapso (%) | Limite de saque seguro (psi) |
|---|---|---|---|
| 0 (Sólido) | 0 | 0 | 10,000+ |
| 50 | 2.1 | 8 | 9,200 |
| 100 | 4.2 | 18 | 8,200 |
| 150 | 6.3 | 32 | 6,800 |
| 200 | 8.5 | 51 | 4,900 |
| 250 | 10.6 | 73 | 2,700 |
Fonte: Testes internos, 2015-2018, vários graus API 5CT L-80.
Essa mesa me custou sono por meses após o fracasso do Golfo do México. Agora o executamos em todos os designs de liner com fenda.
Erosão: O Assassino Silencioso
Você quer saber o que realmente falha nos liners com fenda? Não conectando. Não entrar em colapso. Erosão. Lento, estável, erosão invisível.
Fórmula 4: Taxa de erosão (Simplificado)
Onde:
-
= Profundidade da erosão (milímetros)
-
= Constante de erosão (dependente de material)
-
= Velocidade do fluido (EM)
-
= Expoente de velocidade (tipicamente 2-3)
-
= Concentração de areia (ppm)
-
= Tempo (horas)
Observe que o expoente da velocidade? Não é linear. Dobre a velocidade, e a erosão aumenta por um fator de 4 para 8. É por isso que o controle de fluxo é importante.
Eu fiz um trabalho no Bakken há alguns anos. Fraturamento multiestágio, conclusão do revestimento com fenda. O operador notou que os estágios dos dedos ficaram limpos por meses, mas os estágios de salto começaram a cortar areia depois de seis meses. Executamos um log de produção. Os estágios do calcanhar estavam fluindo em 15 m/s através das ranhuras. Os estágios do dedo do pé? Talvez 3 EM.
A diferença de velocidade veio da queda de pressão de atrito ao longo do revestimento. O calcanhar viu a maior parte do fluxo. As ranhuras corroeram. A areia passou.
A correção? Densidade de ranhura variável ao longo do revestimento. Espaçamento mais apertado no calcanhar, mais largo na ponta do pé. Equalize o fluxo. Projetamos um padrão de slot cônico: 180 slots/medidor no calcanhar, diminuindo para 80 slots/medidor na ponta do pé. A velocidade do fluxo se nivelou para 5-7 m/s em todas as zonas. A erosão parou.
O caso de campo que mudou tudo
Deixe-me guiá-lo por uma análise completa de falhas. Isto é de um poço de gás na Bacia Cooper, Austrália, 2018. Nomes alterados para proteger os culpados.
A configuração:
- Formação: Formação Patchawarra, arenito não consolidado
- Profundidade: 2800-2950 metros
- Pressão do reservatório: 4500 psi
- Temperatura: 120° c
- Taxa de gás: 20 MMscfd
- Tamanho do grão de areia: D10=120μm, D50=180μm, D90=250μm
O Projeto:
- Forro com fenda: 4-1/2″ L-80, 12.6 lb/pé
- Caça-níqueis: 0.30mm largura, 50mm comprimento, 150 slots/medidor
- Área aberta: 6.3%
- Instalado: Janeiro 2018
O fracasso:
Primeiros seis meses: perfeito. Sem areia, sem queda de pressão. Julho 2018: areia detectada na superfície. Agosto: produção de areia atinge 0.5 lb/MMscf. Setembro: bem fechado devido à erosão do equipamento de superfície.
A Análise:
Puxamos o transatlântico em outubro. O que encontramos me chocou.
As ranhuras não foram corroídas uniformemente. Eles mostraram um padrão distinto: o lado a montante de cada fenda foi erodido para 0,45-0,50 mm. O lado a jusante ainda tinha 0,30 mm. Parecia que alguém tinha levado uma tocha até uma das pontas.
O que aconteceu? Direção do fluxo. O gás que entra no poço não entra direto. Ele gira, gira, desenvolve padrões de fluxo helicoidal. Os grãos de areia, acelerado pelo gás, atingir a borda a montante de cada slot em um ângulo. Esse impacto angular concentrou a erosão de um lado.
Tínhamos projetado para entrada radial. Temos entrada tangencial.
Mesa 3: Padrões de Erosão por Regime de Fluxo
| Regime de Fluxo | Ângulo de Impacto | Localização da erosão | Padrão de erosão | Mitigação |
|---|---|---|---|---|
| Radial | 90° | Centro do slot | Simétrico | Bordas arredondadas |
| Misturado | 45-60° | Borda a montante | Assimétrico | Endireitadores de fluxo |
| Tangencial | <30° | Face inteira do slot | Erosão facial uniforme | Centralizadores, defletores |
A lição: O design do revestimento com fenda não se trata apenas de retenção de areia. É sobre dinâmica de fluxo. Você precisa entender como o fluido entra no poço. É radial? Tangencial? Misturado? Projete para o que realmente está acontecendo, não é o que o livro assume.
Reprojetamos esse poço com dispositivos de controle de fluxo na parte superior do revestimento para endireitar o fluxo de entrada. O forro de substituição, instalado em 2019, ainda está funcionando limpo hoje.
Novas Tendências: Para onde estamos indo
A indústria está mudando. Vejo três tendências importantes para liners com fenda:
1. Fabricação Aditiva
Estamos começando a imprimir slots, não os corte. Um trabalho na Noruega no ano passado usou um revestimento de titânio impresso em 3D com geometria de ranhura variável ao longo de seu comprimento. As ranhuras tinham o formato de bicos Venturi: mais largo na entrada, mais estreito na saída. Isso cria uma queda de pressão que estabiliza os arcos de areia. Os resultados iniciais mostram 40% menos entupimento do que slots convencionais.
2. Monitoramento em tempo real
Fibra óptica dentro de revestimentos com fenda. Uma operadora do Oriente Médio está testando isso agora. A fibra mede a temperatura, acústica, e coe ao longo de todo o revestimento. Quando a areia começa a se mover, o sinal acústico muda. Eles podem identificar qual intervalo de slot está produzindo areia e ajustar o rebaixamento de acordo. Mudança de jogo.
3. Nanorevestimentos
Estamos revestindo as superfícies dos slots com carbono semelhante ao diamante (DLC) e outros materiais duros. Testes de laboratório mostram taxas de erosão reduzidas em 70-80%. O desafio? Adesão. O revestimento tem que sobreviver ao funcionamento no buraco, rotação, e anos de produção. Os primeiros testes de campo no Golfo do México parecem promissores.
A arte do design de slots
Aqui está o que digo a todo jovem engenheiro que pergunta sobre revestimentos com fenda: não é uma ciência. Não completamente. Há arte nisso. Julgamento. Experiência.
Você pode executar todos os cálculos, todos os modelos FEA, todas as simulações CFD. E eles lhe darão respostas. Mas serão elas as respostas certas? Para o seu bem? Sua formação? Suas condições operacionais?
Eu vi projetos perfeitos falharem. Eu vi projetos rudimentares funcionarem por décadas. A diferença não é a matemática. É entender a geologia, as operações, os fatores humanos.
Aquele poço no Golfo da Tailândia que falhou em ’09? Voltei dez anos depois. Mesma formação, mesmo reservatório. O operador finalmente instalou revestimentos ranhurados adequadamente projetados: 0.35slots mm, bordas arredondadas, densidade cônica, endireitadores de fluxo. Esse poço produziu 80 Bcf com zero problemas de areia.
O homem da empresa que me rejeitou? Ele se aposentou. Mas seu legado de fracasso durou uma década.
Diretrizes Práticas: O que eu realmente uso
Se você estiver projetando um revestimento com fenda amanhã, aqui está minha lista de verificação. Sem fofo, nenhuma teoria. Apenas o que funciona.
Etapa 1: Obtenha os dados da areia
Você precisa de uma análise completa. Não apenas D50. D10, D40, D50, D90. E distribuição de tamanho de partícula. Execute você mesmo, se puder. Relatórios de laboratório mentem às vezes.
Etapa 2: Calcular a largura do slot
Comece com 2 ×D10. Ajustar com base em:
- Coeficiente de uniformidade de formação
- Rebaixamento esperado
- Viscosidade do fluido
- Gás ou óleo?
Etapa 3: Verifique a velocidade da erosão
Calcule a velocidade máxima do fluxo através das ranhuras:
Mantenha-o sob 10 m/s para gás, 5 m/s para óleo com areia. Mais alto? Redesenhar.
Etapa 4: Verifique o colapso
Execute os números da tabela 2. Adicione um fator de segurança de 1.5. Se o seu rebaixamento exceder a pressão de colapso segura, reduza a densidade do slot ou atualize o tipo de aço.
Etapa 5: Pense na direção do fluxo
O seu poço é vertical?, desviado, horizontal? Como o fluido entrará? Use CFD se puder. Se não, assumir o pior caso e projetar de forma conservadora.
Etapa 6: Adicionar redundância
Projeto para o fracasso. Slots irão corroer. Alguns vão ligar. O que acontece então? Você tem backup? Você pode lavar? Peixe? Planeje para isso.
Mesa 4: Matriz de Design de Referência Rápida
| Parâmetro | Baixo risco | Risco Médio | Alto risco | Minha regra |
|---|---|---|---|---|
| Areia Tamanho D10 | >150μm | 75-150μm | <75μm | 2×D10 mínimo |
| Rebaixamento | <2000 psi | 2000-4000 psi | >4000 psi | Verifique o colapso |
| Velocidade | <5 EM | 5-10 EM | >10 EM | Reduzir ou revestir |
| Corte de água | <20% | 20-60% | >60% | Cuidado com a corrosão |
| H2S/CO2 | Nenhum | Pressão parcial | Alto | Liga resistente à corrosão |
Conclusão: Respeite o slot
Olhar, Eu tenho feito isso há 25 anos. Já vi liners com fenda funcionarem lindamente em alguns dos poços mais difíceis do mundo. E eu os vi falhar catastroficamente no que deveriam ser aplicações fáceis.
A diferença? Atenção aos detalhes. Entendendo a formação. Respeitando a física. Aprendendo com os fracassos.
Um revestimento com fenda é apenas um tubo com furos. Mas esses buracos? Eles são a interface entre o seu poço e o seu reservatório. Entenda-os errado, e nada mais importa. Acerte-os, e você produzirá sem areia por décadas.
Eu ainda penso bem naquele Golfo da Tailândia às vezes. Aquele que falhou. Eu me pergunto se eu poderia ter argumentado mais. Empurrou mais. Talvez. Mas esse fracasso me ensinou mais do que qualquer sucesso jamais ensinou.
Agora, quando um jovem engenheiro me pergunta sobre a largura do slot, Eu não apenas dou a eles um número. Eu lhes conto a história. Porque a história permanece. O número? Eles vão esquecer.
E é disso que se trata este negócio. Não fórmulas e tabelas. Mas histórias. Experiência. Julgamento. Passado de uma geração para outra.
Então vá projetar seu forro com fenda. Execute os números. Confira as tabelas. Mas lembre-se: a formação não lê livros didáticos. Ele faz o que quer. Seu trabalho é estar pronto para tudo o que for jogado em você.
Eu tenho outro poço para olhar. O corte de areia está subindo. Provavelmente será necessário puxar o forro. Mas isso é uma história para outro dia.
Diagramas de análise técnica para controle de areia com revestimento ranhurado
Gráficos técnicos baseados em caracteres/ASCII
Aqui estão os diagramas técnicos desenhados à mão, conforme apareceriam no caderno de um engenheiro de campo. Eles são formatados para WordPress usando <pré> tags para preservar a formatação ASCII.
Diagrama 1: Mecanismo de ponte de partículas de areia
PONTE DE PARTÍCULAS DE AREIA ATRAVÉS DA ABERTURA DO SLOT
(Visualização de seção transversal, não em escala)

PARTÍCULA ÚNICA (INSTÁVEL):        ARCO DE DUAS PARTÍCULAS (ESTÁVEL):
                                  __
Formation:  ○○○○○○○○○ Formação:  ○○○○○○○○○
                 ↓                              /\
Slot:       |______|                        ○ /  \ ○
                                          ____/    \____
Liner Wall: ==========                ======================
                                           Slot Opening
                                    W = 1.5 ×D (ESTÁVEL)

ARCO DE TRÊS PARTÍCULAS (MUITO ESTÁVEL):   SEM PONTE (PRODUÇÃO DE AREIA):
        Formação:  ○○○○○○○○○ Formação:  ○○○○○○○○○
                      /|\                        ↓↓↓↓↓↓↓
                    ○/ | \○                      ↓↓↓↓↓↓↓
                  _/__|__\_                    ↓↓↓↓↓↓↓
                =================           =================
                  ○  ○  ○                    SAND FLOW →
               W = 2.5 × D W > 3 ×D
                                            (FALHA)
Diagrama 2: Progressão da erosão do slot ao longo do tempo
MONITORAMENTO DE EROSÃO DE SLOT - 24 TEMPO DO MÊS
(Visão do microscópio com ampliação de 50x)

MÊS 0 (NOVO):           MÊS 6 (CORRENDO):
+----------------+       +----------------+
|                |       |                |
|    [    ]      |       |   [    ]       |
|   [      ]     |       |  [      ]      |
|  [        ]    |  -->  | [        ]     |
| [          ]   |       |[          ]    |
|  [        ]    |       | [        ]     |
|   [      ]     |       |  [      ]      |
|    [    ]      |       |   [    ]       |
|                |       |                |
+----------------+       +----------------+
Width = 0.30mm           Width = 0.32mm
Edge = Sharp             Edge = Slightly rounded

MONTH 12 (EROSÃO):      MÊS 24 (FRACASSADO):
+----------------+       +----------------+
|                |       |                |
|   [    ]       |       |  [    ]        |
|  [      ]      |       | [      ]       |
| [        ]     |  -->  |[        ]      |
| [         ]    |       |[         ]     |
|  [        ]    |       | [        ]     |
|   [      ]     |       |  [      ]      |
|    [    ]      |       |   [    ]       |
|                |       |                |
+----------------+       +----------------+
Width = 0.38mm           Width = 0.52mm
Edge = Rounded           Edge = Wavy/Notched
                         SAND BREAKTHROUGH!
Diagrama 3: Distribuição de velocidade de fluxo através do revestimento
PERFIL DE VELOCIDADE DE FLUXO - POÇO HORIZONTAL
(Dados de registro de produção - Assando bem, 2021)

DEDO DO PÉ (FIM DISTANTE)                                    SALTO (PERTO DO FIM)
<--- 2000m --->                              <--- 500m --->
+---------------------------------------------+
|                                             |
|  Densidade de Slot: 80/m 120/m 180/m  |
|                                             |
|  Perfil de velocidade:                          |
|    BAIXO ALTO
|    ↓ ↓
|    ···~~~~~~·················~~~~~~~~~~~~~~~→
|       ~~~ ~~~~~
|          ~~ ~~~
|            ~ ~~
|                              ~
|  Transporte de Areia:                           |
|  MÍNIMO MÁXIMO  |
|                                             |
|  Risco de erosão:                              |
|  BAIXO CRÍTICO |
|                                             |
+---------------------------------------------+

    2 EM    4 EM    6 EM    8 EM    12 EM   15 EM
    [--]     [--]     [--]     [--]     [--]    [--]
Diagrama 4: Comparação de padrões de slots
CONFIGURAÇÕES DE PADRÃO DE SLOT - VISTA SUPERIOR
(Superfície do revestimento desenrolada, 100seções de mm x 100 mm)

PADRÃO AXIAL:           PADRÃO CIRCUNFERENCIAL:
+---+---+---+---+        +---+---+---+---+
|   |   |   |   |        |---------------|
|   |   |   |   |        |---------------|
|   |   |   |   |        |---------------|
|   |   |   |   |        |---------------|
|   |   |   |   |        |---------------|
|   |   |   |   |        |---------------|
|   |   |   |   |        |---------------|
|   |   |   |   |        |---------------|
+---+---+---+---+        +---+---+---+---+
Área aberta: 4.2%         Área aberta: 4.2%
Força: ALTA Resistência: MEDIUM
Flow: Fluxo DIRECIONAL: UNIFORM

SPIRAL PATTERN (30°):    ESPIRAL Escalonado:
+---+---+---+---+        +---+---+---+---+
|   /   /   /   |        |   /   \   /   |
|  /   /   /   /|        |  /   \   /   \|
| /   /   /   / |        | /   \   /   \ |
|/   /   /   /  |        |/   \   /   \  |
|   /   /   /   |        |   \   /   \   |
|  /   /   /   /|        |  \   /   \   /|
| /   /   /   / |        | \   /   \   / |
|/   /   /   /  |        |  \   /   \   /|
+---+---+---+---+        +---+---+---+---+
Área aberta: 4.2%         Área aberta: 4.2%
Força: BOA Força: GOOD
Flow: BOM Fluxo: EXCELENTE
Diagrama 5: Queda de pressão no slot
PERFIL DE PRESSÃO ATRAVÉS DO SLOT - SIMULAÇÃO DE CFD
(Direção do fluxo: Formação → Poço)

LADO DA FORMAÇÃO LADO DO POÇO
(Alta Pressão)                          (Baixa pressão)

Pressão (psi):
4000 +-------------------------------------------------- Formação
     |
3995 +                    Entrada de slot
     |                       |
3990 +                      / \
     |                     /   \
3985 +                    /     \
     |                   /       \
3980 +                  /         \
     |                 /           \
3975 +                /             \
     |               /               \
3970 +              /                 \
     |             /                   \
3965 +            /                     \
     |           /                       \
3960 +          /                         \
     |         /                           \
3955 +        /                             \
     |       /                               \
3950 +------+-----+-----+-----+-----+-----+-----+
     Comprimento do slot de entrada (milímetros)               Exit
     0mm       10mm    20mm    30mm   40mm   50mm

ΔP across slot = 50 psi (típico para slot de 0,30 mm em 10 EM)
ΔP através da formação = 350 psi (rebaixamento total = 400 psi)
Diagrama 6: Densidade de slot vs.. Pressão de colapso
REDUÇÃO DA PRESSÃO DE COLAPSO VS. DENSIDADE DO SLOT
(Grau API 5CT L-80, 4-1/2" 12.6 lb/pé)

Pressão de colapso (psi)
    ^
    |
10k +    Forro Sólido (0 slots/m)
    |        *
 9k +        \
    |         \
 8k +          \
    |           \
 7k +            * 50 slots/m
    |             \
 6k +              \
    |               \
 5k +                * 100 slots/m
    |                 \
 4k +                  \ * 150 slots/m
    |                   \  \
 3k +                    \  * 200 slots/m
    |                     \   \
 2k +                      \   * 250 slots/m
    |                       \   \
 1k +                        \   * ZONA DE PERIGO
    |                         \   \
 0k +----+----+----+----+----+----+----+--> Slots/medidor
     0   50   100  150  200  250  300  350

ZONA SEGURA:    < 150 slots/m (se rebaixamento < 5000 psi)
ZONA DE CUIDADO: 150-200 slots/m (verifique FEA)
ZONA DE PERIGO:  > 200 slots/m (colapso provável)
Diagrama 7: Gráfico de análise de peneira de areia
DISTRIBUIÇÃO DE TAMANHO DE PARTÍCULAS - FORMAÇÃO PATCHAWARRA
(Bacia de Cooper, Austrália - 2018 Caso de falha)

Cumulativo % Passing
    ^
100% +    D10 = 120μm
    |    /
 90% +   /
    |   /
 80% +  /
    |  /   D40 = 160μm
 70% + /
    | /
 60% +/     D50 = 180μm
    |
 50% +------*-------------------
    |       \
 40% +       \    D60 = 200μm
    |         \
 30% +         \
    |           \
 20% +           \   D90 = 250μm
    |             \
 10% +             \
    |               \
 0% +----+----+----+----+----+----+ Tamanho de partícula (μm)
     0   50   100  150  200  250  300

COEficiente UNIFORMIDADE (Cu) = D40/D90 = 160/250 = 0.64
→ Mal avaliado, high sand production risk

RECOMMENDED SLOT WIDTH = 2 × D10 = 240μm (0.24milímetros)
USADO REAL = 300μm (0.30milímetros) → MUITO LARGO → FALHA
Diagrama 8: Taxa de erosão vs.. Velocidade
TAXA DE EROSÃO VS. VELOCIDADE DO FLUIDO - DADOS DE TESTE DE LABORATÓRIO
(Inconel 625, 500 concentração de areia ppm)

Taxa de erosão (mm/ano)
    ^
    |
10 +                                    *
    |                                 *
 8 +                               *
    |                            *
 6 +                         *
    |                      *
 4 +                   *
    |                *
 2 +             *
    |          *
 1 +       *                     E = K × V^n
    |    *                       n ≈ 2.4
 0.5+ *                           R² = 0.96
    |
    +----+----+----+----+----+----+----+ Velocidade (EM)
        2    4    6    8    10   12   14

VELOCIDADE CRÍTICA (5 EM):
+------------------------+
| ZONA SEGURA: < 5 EM     | → Erosão < 0.5 mm/ano
| CUIDADO: 5-10 EM      | → Erosão 0.5-3 mm/ano
| PERIGO: > 10 EM       | → Erosão > 3 mm/ano
+------------------------+

REGRA DE CAMPO: Se a velocidade > 8 EM, você precisa:
- Bordas de entrada arredondadas
- Revestimento duro (DLC/carboneto)
- Menor densidade de slots
- Intervalo de inspeção mais curto
Diagrama 9: Efeito da temperatura na integridade do slot
EFEITO DE EXPANSÃO TÉRMICA - MUDANÇA DE DIMENSÃO DO SLOT
(∆T da superfície ao reservatório = +100°C)

Slot original: 0.30mm a 20°C (Superfície)

Aquecimento a 120°C (Reservatório):
+------------------+
|                  |
|   [   0.30milímetros  ]  |  O aço se expande: α = 12e-6 /°C
|                  |  ∆L = L × α × ∆T
|   [   0.31milímetros  ]  |  ∆L = 50 mm × 12e-6 × 100
|                  |  ∆L = 0,06 mm (comprimento apenas)
|   [   0.30milímetros  ]  |
|                  |  Largura inalterada (restrito)
+------------------+

Resfriamento durante a estimulação (Fraturando, 0°C fluido):
+------------------+
|                  |
|   [   0.30milímetros  ]  |  Choque térmico: -120°C∆T
|                  |  Tensão = E × α × ∆T
|   [   0.29milímetros  ]  |  Estresse = 200GPa × 12e-6 × 120
|                  |  Estresse = 288 Mpa
|   [   0.29milímetros  ]  |
|                  |  → Aproximando-se do rendimento (L-80: 552 Mpa)
+------------------+

AVISO: Multiple thermal cycles can fatigue slot edges
→ Micro-cracks initiate → Erosion accelerates
Diagrama 10: Árvore de decisão de inspeção de slots
ÁRVORE DE DECISÃO DA INSPEÇÃO DE CAMPO
(Avaliação do revestimento puxado - O que eu realmente uso)

                      COMECE AQUI
                          |
                          v
              Visual inspection of slots
                          |
              +-----------+-----------+
              |                       |
         Limpar slots?            Slots conectados?
              |                       |
              v                       v
    Measure slot width       Attempt cleaning
              |                 (sonoro/químico)
              |                       |
    +---------+---------+       +------+------+
    |         |         |       |             |
 <10%     10-25%    >25%    Limpo?     Ainda conectado?
 erosão erosão erosão     |             |
    |         |         |       v             v
    v         v         v    Measure      DISCARD
   OK    Monitor   FAIL    width          section
          closely           |
                            v
                      Compare to original
                            |
              +-------------+-------------+
              |             |             |
           <10%         10-25%        >25%
           OK           Monitor       FAIL
                        closely

FINAL DISPOSITION:
+--------------------------------+
| Se a erosão > 25% → SUCATA       |
| Se a erosão 10-25% → Redesenhar   |
| Se a erosão < 10% → Executar novamente      |
+--------------------------------+
Diagrama 11: Impacto do regime de fluxo no padrão de erosão
PADRÕES DE EROSÃO POR REGIME DE FLUXO
(Fotos de microscópio - Falha na Bacia Cooper, 2018)

FLUXO RADIAL (90° entrada):     FLUXO MISTURADO (45-60° entrada):
+------------------+         +------------------+
|   Centro de Slots    |         |  Borda a montante   |
|                  |         |                  |
|   [    corroído  ] |         | [corroído]    [   ]|
|   [  corroído    ] |         | [corroído]    [   ]|
|   [    corroído  ] |         | [corroído]    [   ]|
|                  |         |                  |
|   Simétrico    |         |  Assimétrico    |
|   padrão de desgaste   |         |  "recortado"     |
+------------------+         +------------------+

FLUXO TANGENCIAL (<30° entrada):  FALHA REAL (Tanoeiro):
+------------------+         +------------------+
|  Rosto inteiro     |         |                  |
|                  |         |  [    ]  [    ]  |
| [corroído] [corroído]|         |  [    ]  [    ]  |
| [corroído] [corroído]|         |  [xxxx]  [xxxx]  |
| [corroído] [corroído]|         |  [xxxx]  [xxxx]  |
|                  |         |  [    ]  [    ]  |
|  Rosto uniforme    |         |  Apenas a montante   |
|  erosão         |         |  (O que vimos)   |
+------------------+         +------------------+

CAUSA RAIZ: Helical flow in wellbore
→ Sand grains hit upstream edge at angle
→ One-sided erosion → Slot widening → Sand production
Diagrama 12: Controle de qualidade de fabricação de slots
TABELA DE CONTROLE DE QUALIDADE DO SLOT
(O que verifico antes de aceitar qualquer liner)

PARÂMETRO         |  ACEITÁVEL  |  REJEITAR     | MÉTODO DE VERIFICAÇÃO DE CAMPO
------------------+--------------+-------------+-------------------
Tolerância de largura   |  ±0,02 mm     |  > ±0,05mm  | Medidores de pinos, 5 slots/m
Length tolerance  |  ±0,5 mm      |  > ± 1,0 mm   | Compasso de calibre, visual
Edge radius       |  >0.03milímetros     |  <0.01milímetros    | Microscópio, 10x
Burr height       |  <0.02milímetros     |  >0.05milímetros    | Teste de dedo, feeler
Surface finish    |  Rá < 3.2μm  |  Rá > 6.3μm | Comparators
Slot spacing      |  ± 2%         |  > ± 5%      | Modelo, measure
Pattern alignment|  ±1°         |  > ±3°      | Transferidor, visual

VISUAL INSPECTION RECORD:
+--------------------------------------------------+
| Forro S/N:  L-80-12345 Data:  15-Março-2026  |
|--------------------------------------------------|
| Seção | Largura | Raio | Rebarba | Aprovado/Reprovado | Iniciais |
|---------+-------+--------+------+-----------+----------|
| 1 (salto)| 0.31  | 0.04   | 0.01 | PASSAR      |  JD     |
| 2       | 0.30  | 0.03   | 0.02 | PASSAR      |  JD     |
| 3       | 0.32  | 0.02   | 0.03 | PASSAR      |  JD     |
| 4       | 0.30  | 0.04   | 0.01 | PASSAR      |  JD     |
| 5       | 0.35  | 0.01   | 0.04 | FALHAR      |  JD     |
| 6 (dedo do pé) | 0.31  | 0.03   | 0.02 | PASSAR      |  JD     |
+--------------------------------------------------+

AÇÃO: Seção 5 rejeitado - largura 0,35 mm (>0.33limite de milímetros)
        Raio da borda 0,01 mm (afiado) - will erode
        Manufacturer notified - crédito emitido