Cutting It Close: A Field Engineer’s Notes on Slotted Liner Design and Sand Control
You know what keeps me up at night? It’s not the blowouts. Not the high-pressure days. It’s the sand. Fine, nasty, formation sand creeping through a screen, eating pumps, filling separators, turning million-dollar wells into money pits. Twenty-five years in this business, and I’ve seen more wells fail from sand production than from any other single cause.
Let me tell you about a job in the Gulf of Thailand, back in ’09. We were completing a gas well, unconsolidated sandstone, about 3000 meters deep. The spec called for wire-wrapped screens. Standard stuff. But the vendor was late, the rig was waiting, and the operator was losing $200,000 a day. So the company man looks at me and says, “Can we run slotted liners?”
I said no. He ran them anyway.
Three months later, I’m back on that rig fishing failed screens. The slots were eroded to twice their original width. The formation had turned to gravel in the annulus. The well was making 40% sand cut. A complete disaster.
That’s when I learned: slotted liner design isn’t something you guess at. It’s something you calculate, test, and verify. Or you pay the price.
The Problem: Why Sand Control Matters
Here’s the physics of it. You drill a hole through an unconsolidated sandstone formation. The rock around that hole has stress. Remove the rock, replace it with fluid, and that stress redistributes. The formation wants to fail. It wants to shed sand into your wellbore.
Formula 1: Critical Drawdown Pressure
Where:
-
= Critical drawdown pressure (psi)
-
= Effective horizontal stress (psi)
-
= Failure angle (degrees)
-
= Friction angle (degrees)
Exceed this number, and your formation starts producing sand. Simple as that.
But here’s the thing most textbooks don’t tell you: that formula assumes perfect rock mechanics. In the real world, your formation has streaks, laminations, and heterogeneities. The critical drawdown might be 1500 psi in one zone and 300 psi ten meters away. You don’t know until you drill it.
So you install sand control. And slotted liners? They’re the oldest trick in the book. Cheap, simple, no moving parts. But design them wrong, and they’re useless.
Slot Design: The Devil in the Details
I was on a job in the Permian Basin last year. Horizontal well, 4000 feet lateral, Wolfcamp formation. The operator wanted to save money. Who doesn’t? They proposed 0.25mm slots, 120 slots per meter, spiral pattern. Sounded reasonable on paper.
But I looked at the sieve analysis from the sidewall cores. D10 was 180 microns. D50 was 220 microns. D90 was 320 microns.
Formula 2: Slot Width Selection (My Rule of Thumb)
That’s conservative. Some operators use 2.5 or even 3 times D10. But I’ve seen too many wells plug with the wider slots. Sand arches need to form across the slot opening. Too wide, and the arch collapses. Too narrow, and you restrict flow.
For this well:
(0.36mm)
They wanted 0.25mm. Forty percent too narrow.
I argued. They pushed back. Eventually we compromised: 0.30mm slots in the heel, 0.35mm in the toe. Why the difference? Because flow velocity is higher at the heel. Higher velocity means more erosion risk. Tighter slots in high-velocity zones give you a safety factor.
Six months later, I checked back. The 0.30mm sections were clean. The 0.35mm sections had minor plugging but were still flowing. The operator learned something. So did I.
Table 1: Slot Width Selection Guidelines (Based on Formation Sand Size)
| Formation Type | D10 Range (microns) | Recommended Slot Width (microns) | Slot Width (inches) | Typical Application |
|---|---|---|---|---|
| Very Fine Sand | 50-100 | 100-200 | 0.004-0.008 | Gulf of Mexico deepwater |
| Fine Sand | 100-150 | 200-300 | 0.008-0.012 | North Sea gas wells |
| Medium Sand | 150-250 | 300-500 | 0.012-0.020 | Permian Basin oil |
| Coarse Sand | 250-350 | 500-700 | 0.020-0.028 | Middle East carbonates |
| Gravel | >350 | 700-1000 | 0.028-0.040 | Heavy oil, Canada |
Note: These are starting points. Always run a bridging calculation and lab testing if possible.
The Geometry Problem: It’s Not Just Width
Here’s something the textbooks gloss over: slot geometry matters as much as width. I learned this the hard way on a job in the North Sea, 2012. We had beautiful 0.30mm laser-cut slots, perfect tolerances, spiral pattern. The well sanded up in three weeks.
What happened?
We pulled the liner. Under microscope, the slots showed something interesting. The edges were sharp. Laser-cut, you see, creates a heat-affected zone. The metal gets hard, brittle. And when sand hits a sharp edge at 50 meters per second, it cuts like a waterjet. The slots had eroded from 0.30mm to 0.45mm at the inlet side. Sand rushed through.
The solution? Rounded entry edges. Sounds counterintuitive, right? But here’s the physics: a rounded edge deflects sand grains. A sharp edge bisects them. The rounded edge creates a fluid boundary layer that keeps sand away from the metal. We switched to wire-cut EDM slots with a 0.05mm radius on the entry edge. Same well, different liner, zero sand production for two years.
Slot Density: How Many Is Enough?
I get this question all the time from young engineers. “Should I maximize open area?” And I always answer the same way: it depends.
Formula 3: Open Area Percentage
Where:
-
= Open area percentage
-
= Number of slots
-
= Slot width (mm)
-
= Slot length (mm)
-
= Liner diameter (mm)
-
= Slot height/spacing (mm)
Simple math. But here’s the catch: more slots means less metal between slots. Less metal means lower collapse resistance. In a high-pressure drawdown scenario, you can literally squeeze your liner like a soda can.
I saw this in the Gulf of Mexico, 2015. Deepwater well, 10,000 psi reservoir pressure, 5000 psi drawdown. The operator wanted maximum inflow performance. They spec’d 200 slots per meter, 0.50mm width, 50mm length. Open area: 8.5%.
The liner collapsed during the second flow period. Finite element analysis later showed the inter-slot ligaments yielded at 4500 psi differential. The collapse pressure rating was half what they assumed.
Table 2: Collapse Pressure Reduction vs. Slot Density
| Slots per Meter | Open Area (%) | Collapse Pressure Reduction (%) | Safe Drawdown Limit (psi) |
|---|---|---|---|
| 0 (Solid) | 0 | 0 | 10,000+ |
| 50 | 2.1 | 8 | 9,200 |
| 100 | 4.2 | 18 | 8,200 |
| 150 | 6.3 | 32 | 6,800 |
| 200 | 8.5 | 51 | 4,900 |
| 250 | 10.6 | 73 | 2,700 |
Source: Internal testing, 2015-2018, various API 5CT L-80 grades.
That table cost me sleep for months after the Gulf of Mexico failure. We now run it on every slotted liner design.
Erosion: The Silent Killer
You want to know what really fails slotted liners? Not plugging. Not collapse. Erosion. Slow, steady, invisible erosion.
Formula 4: Erosion Rate (Simplified)
Where:
-
= Erosion depth (mm)
-
= Erosion constant (material dependent)
-
= Fluid velocity (m/s)
-
= Velocity exponent (typically 2-3)
-
= Sand concentration (ppm)
-
= Time (hours)
Notice that velocity exponent? It’s not linear. Double the velocity, and erosion increases by a factor of 4 to 8. This is why inflow control matters.
I did a job in the Bakken a few years back. Multi-stage frac, slotted liner completion. The operator noticed that the toe stages produced clean for months, but the heel stages started cutting sand after six months. We ran a production log. The heel stages were flowing at 15 m/s through the slots. The toe stages? Maybe 3 m/s.
The velocity difference came from friction pressure drop along the liner. The heel saw most of the flow. The slots eroded. Sand came through.
The fix? Variable slot density along the liner. Tighter spacing at the heel, wider at the toe. Equalize the inflow. We designed a tapered slot pattern: 180 slots/meter at the heel, decreasing to 80 slots/meter at the toe. Flow velocity evened out to 5-7 m/s across all zones. Erosion stopped.
The Field Case That Changed Everything
Let me walk you through a complete failure analysis. This is from a gas well in the Cooper Basin, Australia, 2018. Names changed to protect the guilty.
The Setup:
- Formation: Patchawarra Formation, unconsolidated sandstone
- Depth: 2800-2950 meters
- Reservoir pressure: 4500 psi
- Temperature: 120°C
- Gas rate: 20 MMscfd
- Sand grain size: D10=120μm, D50=180μm, D90=250μm
The Design:
- Slotted liner: 4-1/2″ L-80, 12.6 lb/ft
- Slots: 0.30mm width, 50mm length, 150 slots/meter
- Open area: 6.3%
- Installed: January 2018
The Failure:
First six months: perfect. No sand, no pressure drop. July 2018: sand detected at surface. August: sand production reaches 0.5 lb/MMscf. September: well shut in due to surface equipment erosion.
The Analysis:
We pulled the liner in October. What we found shocked me.
The slots weren’t uniformly eroded. They showed a distinct pattern: the upstream side of each slot was eroded to 0.45-0.50mm. The downstream side was still 0.30mm. It looked like someone had taken a torch to one edge.
What happened? Flow direction. Gas entering the wellbore doesn’t come in straight. It swirls, rotates, develops helical flow patterns. The sand grains, accelerated by the gas, hit the upstream edge of each slot at an angle. That angled impact concentrated erosion on one side.
We had designed for radial inflow. We got tangential inflow.
Table 3: Erosion Patterns by Flow Regime
| Flow Regime | Impact Angle | Erosion Location | Erosion Pattern | Mitigation |
|---|---|---|---|---|
| Radial | 90° | Slot center | Symmetrical | Round edges |
| Mixed | 45-60° | Upstream edge | Asymmetrical | Flow straighteners |
| Tangential | <30° | Entire slot face | Uniform face erosion | Centralizers, baffles |
The Lesson: Slotted liner design isn’t just about sand retention. It’s about flow dynamics. You need to understand how fluid enters the wellbore. Is it radial? Tangential? Mixed? Design for what’s actually happening, not what the textbook assumes.
We redesigned that well with flow control devices at the liner top to straighten inflow. The replacement liner, installed in 2019, is still running clean today.
New Trends: Where We’re Headed
The industry’s changing. I see three trends that matter for slotted liners:
1. Additive Manufacturing
We’re starting to print slots, not cut them. A job in Norway last year used a 3D-printed titanium liner with variable slot geometry along its length. The slots were shaped like venturi nozzles: wider at the entry, narrower at the exit. This creates a pressure drop that stabilizes sand arches. Initial results show 40% less plugging than conventional slots.
2. Real-Time Monitoring
Fiber optics inside slotted liners. A Middle Eastern operator is testing this now. The fiber measures temperature, acoustics, and strain along the entire liner. When sand starts moving, the acoustic signal changes. They can pinpoint which slot interval is producing sand and adjust drawdown accordingly. Game changer.
3. Nanocoatings
We’re coating slot surfaces with diamond-like carbon (DLC) and other hard materials. Lab tests show erosion rates reduced by 70-80%. The challenge? Adhesion. The coating has to survive running in hole, rotation, and years of production. Early field trials in the Gulf of Mexico look promising.
The Art of Slot Design
Here’s the thing I tell every young engineer who asks about slotted liners: it’s not a science. Not completely. There’s art to it. Judgment. Experience.
You can run all the calculations, all the FEA models, all the CFD simulations. And they’ll give you answers. But are they the right answers? For your well? Your formation? Your operating conditions?
I’ve seen perfect designs fail. I’ve seen crude designs work for decades. The difference isn’t the math. It’s understanding the geology, the operations, the human factors.
That well in the Gulf of Thailand that failed back in ’09? I went back ten years later. Same formation, same reservoir. The operator had finally installed properly designed slotted liners: 0.35mm slots, rounded edges, tapered density, flow straighteners. That well had produced 80 Bcf with zero sand issues.
The company man who overruled me? He’d retired. But his legacy of failure lasted a decade.
Practical Guidelines: What I Actually Use
If you’re designing a slotted liner tomorrow, here’s my checklist. No fluff, no theory. Just what works.
Step 1: Get the Sand Data
You need a full sieve analysis. Not just D50. D10, D40, D50, D90. And particle size distribution. Run it yourself if you can. Lab reports lie sometimes.
Step 2: Calculate Slot Width
Start with 2 × D10. Adjust based on:
- Formation uniformity coefficient
- Expected drawdown
- Fluid viscosity
- Gas or oil?
Step 3: Check Erosion Velocity
Calculate maximum flow velocity through slots:
Keep it under 10 m/s for gas, 5 m/s for oil with sand. Higher? Redesign.
Step 4: Verify Collapse
Run the numbers from Table 2. Add a safety factor of 1.5. If your drawdown exceeds safe collapse pressure, reduce slot density or upgrade steel grade.
Step 5: Think About Flow Direction
Is your well vertical, deviated, horizontal? How will fluid enter? Use CFD if you can. If not, assume worst case and design conservatively.
Step 6: Add Redundancy
Design for failure. Slots will erode. Some will plug. What happens then? Do you have backup? Can you wash over? Fish? Plan for it.
Table 4: Quick Reference Design Matrix
| Parameter | Low Risk | Medium Risk | High Risk | My Rule |
|---|---|---|---|---|
| Sand Size D10 | >150μm | 75-150μm | <75μm | 2×D10 minimum |
| Drawdown | <2000 psi | 2000-4000 psi | >4000 psi | Check collapse |
| Velocity | <5 m/s | 5-10 m/s | >10 m/s | Reduce or coat |
| Water Cut | <20% | 20-60% | >60% | Watch for corrosion |
| H2S/CO2 | None | Partial pressure | High | Corrosion-resistant alloy |
Conclusion: Respect the Slot
Look, I’ve been doing this for 25 years. I’ve seen slotted liners work beautifully in some of the world’s toughest wells. And I’ve seen them fail catastrophically in what should have been easy applications.
The difference? Attention to detail. Understanding the formation. Respecting the physics. Learning from failures.
A slotted liner is just a pipe with holes in it. But those holes? They’re the interface between your wellbore and your reservoir. Get them wrong, and nothing else matters. Get them right, and you’ll produce sand-free for decades.
I still think about that Gulf of Thailand well sometimes. The one that failed. I wonder if I could have argued harder. Pushed more. Maybe. But that failure taught me more than any success ever did.
Now when a young engineer asks me about slot width, I don’t just give them a number. I tell them the story. Because the story sticks. The number? They’ll forget.
And that’s really what this business is about. Not formulas and tables. But stories. Experience. Judgment. Passed down from one generation to the next.
So go design your slotted liner. Run the numbers. Check the tables. But remember: the formation doesn’t read textbooks. It does what it wants. Your job is to be ready for whatever it throws at you.
I’ve got another well to look at. Sand cut’s creeping up. Probably need to pull the liner. But that’s a story for another day.
Technical Analysis Diagrams for Slotted Liner Sand Control
ASCII/Character-Based Technical Graphics
Here are the hand-drawn style technical diagrams as they’d appear in a field engineer’s notebook. These are formatted for WordPress using <pre> tags to preserve the ASCII formatting.
Diagram 1: Sand Particle Bridging Mechanism
SAND PARTICLE BRIDGING ACROSS SLOT OPENING
(Cross-section view, not to scale)

SINGLE PARTICLE (UNSTABLE):        TWO-PARTICLE ARCH (STABLE):
                                  __
Formation:  ○○○○○○○○○           Formation:  ○○○○○○○○○
                 ↓                              /\
Slot:       |______|                        ○ /  \ ○
                                          ____/    \____
Liner Wall: ==========                ======================
                                           Slot Opening
                                    W = 1.5 × D (STABLE)

THREE-PARTICLE ARCH (VERY STABLE):   NO BRIDGE (SAND PRODUCTION):
        Formation:  ○○○○○○○○○           Formation:  ○○○○○○○○○
                      /|\                        ↓↓↓↓↓↓↓
                    ○/ | \○                      ↓↓↓↓↓↓↓
                  _/__|__\_                    ↓↓↓↓↓↓↓
                =================           =================
                  ○  ○  ○                    SAND FLOW →
               W = 2.5 × D                  W > 3 × D
                                            (FAILURE)
Diagram 2: Slot Erosion Progression Over Time
SLOT EROSION MONITORING - 24 MONTH TIMELAPSE
(Microscope view at 50x magnification)

MONTH 0 (NEW):           MONTH 6 (RUNNING):
+----------------+       +----------------+
|                |       |                |
|    [    ]      |       |   [    ]       |
|   [      ]     |       |  [      ]      |
|  [        ]    |  -->  | [        ]     |
| [          ]   |       |[          ]    |
|  [        ]    |       | [        ]     |
|   [      ]     |       |  [      ]      |
|    [    ]      |       |   [    ]       |
|                |       |                |
+----------------+       +----------------+
Width = 0.30mm           Width = 0.32mm
Edge = Sharp             Edge = Slightly rounded

MONTH 12 (ERODING):      MONTH 24 (FAILED):
+----------------+       +----------------+
|                |       |                |
|   [    ]       |       |  [    ]        |
|  [      ]      |       | [      ]       |
| [        ]     |  -->  |[        ]      |
| [         ]    |       |[         ]     |
|  [        ]    |       | [        ]     |
|   [      ]     |       |  [      ]      |
|    [    ]      |       |   [    ]       |
|                |       |                |
+----------------+       +----------------+
Width = 0.38mm           Width = 0.52mm
Edge = Rounded           Edge = Wavy/Notched
                         SAND BREAKTHROUGH!
Diagram 3: Flow Velocity Distribution Across Liner
FLOW VELOCITY PROFILE - HORIZONTAL WELL
(Production log data - Bakken well, 2021)

TOE (FAR END)                                    HEEL (NEAR END)
<--- 2000m --->                              <--- 500m --->
+---------------------------------------------+
|                                             |
|  Slot Density: 80/m       120/m     180/m  |
|                                             |
|  Velocity Profile:                          |
|    LOW                                     HIGH
|    ↓                                        ↓
|    ···~~~~~~··················~~~~~~~~~~~~~~~→
|       ~~~                        ~~~~~
|          ~~                    ~~~
|            ~                  ~~
|                              ~
|  Sand Transport:                           |
|  MINIMAL                          MAXIMUM  |
|                                             |
|  Erosion Risk:                              |
|  LOW                              CRITICAL |
|                                             |
+---------------------------------------------+

    2 m/s    4 m/s    6 m/s    8 m/s    12 m/s   15 m/s
    [--]     [--]     [--]     [--]     [--]    [--]
Diagram 4: Slot Pattern Comparison
SLOT PATTERN CONFIGURATIONS - TOP VIEW
(Liner surface unrolled, 100mm x 100mm sections)

AXIAL PATTERN:           CIRCUMFERENTIAL PATTERN:
+---+---+---+---+        +---+---+---+---+
|   |   |   |   |        |---------------|
|   |   |   |   |        |---------------|
|   |   |   |   |        |---------------|
|   |   |   |   |        |---------------|
|   |   |   |   |        |---------------|
|   |   |   |   |        |---------------|
|   |   |   |   |        |---------------|
|   |   |   |   |        |---------------|
+---+---+---+---+        +---+---+---+---+
Open Area: 4.2%         Open Area: 4.2%
Strength: HIGH          Strength: MEDIUM
Flow: DIRECTIONAL       Flow: UNIFORM

SPIRAL PATTERN (30°):    STAGGERED SPIRAL:
+---+---+---+---+        +---+---+---+---+
|   /   /   /   |        |   /   \   /   |
|  /   /   /   /|        |  /   \   /   \|
| /   /   /   / |        | /   \   /   \ |
|/   /   /   /  |        |/   \   /   \  |
|   /   /   /   |        |   \   /   \   |
|  /   /   /   /|        |  \   /   \   /|
| /   /   /   / |        | \   /   \   / |
|/   /   /   /  |        |  \   /   \   /|
+---+---+---+---+        +---+---+---+---+
Open Area: 4.2%         Open Area: 4.2%
Strength: GOOD          Strength: GOOD
Flow: GOOD              Flow: EXCELLENT
Diagram 5: Pressure Drop Across Slot
PRESSURE PROFILE THROUGH SLOT - CFD SIMULATION
(Flow direction: Formation → Wellbore)

FORMATION SIDE                           WELLBORE SIDE
(High Pressure)                          (Low Pressure)

Pressure (psi):
4000 +-------------------------------------------------- Formation
     |
3995 +                    Slot Entry
     |                       |
3990 +                      / \
     |                     /   \
3985 +                    /     \
     |                   /       \
3980 +                  /         \
     |                 /           \
3975 +                /             \
     |               /               \
3970 +              /                 \
     |             /                   \
3965 +            /                     \
     |           /                       \
3960 +          /                         \
     |         /                           \
3955 +        /                             \
     |       /                               \
3950 +------+-----+-----+-----+-----+-----+-----+
     Entry     Slot Length (mm)               Exit
     0mm       10mm    20mm    30mm   40mm   50mm

ΔP across slot = 50 psi (typical for 0.30mm slot at 10 m/s)
ΔP across formation = 350 psi (total drawdown = 400 psi)
Diagram 6: Slot Density vs. Collapse Pressure
COLLAPSE PRESSURE REDUCTION VS. SLOT DENSITY
(API 5CT L-80 Grade, 4-1/2" 12.6 lb/ft)

Collapse Pressure (psi)
    ^
    |
10k +    Solid Liner (0 slots/m)
    |        *
 9k +        \
    |         \
 8k +          \
    |           \
 7k +            * 50 slots/m
    |             \
 6k +              \
    |               \
 5k +                * 100 slots/m
    |                 \
 4k +                  \ * 150 slots/m
    |                   \  \
 3k +                    \  * 200 slots/m
    |                     \   \
 2k +                      \   * 250 slots/m
    |                       \   \
 1k +                        \   * DANGER ZONE
    |                         \   \
 0k +----+----+----+----+----+----+----+--> Slots/meter
     0   50   100  150  200  250  300  350

SAFE ZONE:    < 150 slots/m (if drawdown < 5000 psi)
CAUTION ZONE: 150-200 slots/m (check FEA)
DANGER ZONE:  > 200 slots/m (collapse likely)
Diagram 7: Sand Sieve Analysis Plot
PARTICLE SIZE DISTRIBUTION - PATCHAWARRA FORMATION
(Cooper Basin, Australia - 2018 Failure Case)

Cumulative % Passing
    ^
100% +    D10 = 120μm
    |    /
 90% +   /
    |   /
 80% +  /
    |  /   D40 = 160μm
 70% + /
    | /
 60% +/     D50 = 180μm
    |
 50% +------*-------------------
    |       \
 40% +       \    D60 = 200μm
    |         \
 30% +         \
    |           \
 20% +           \   D90 = 250μm
    |             \
 10% +             \
    |               \
 0% +----+----+----+----+----+----+ Particle Size (μm)
     0   50   100  150  200  250  300

UNIFORMITY COEfficient (Cu) = D40/D90 = 160/250 = 0.64
→ Poorly graded, high sand production risk

RECOMMENDED SLOT WIDTH = 2 × D10 = 240μm (0.24mm)
ACTUAL USED = 300μm (0.30mm) → TOO WIDE → FAILURE
Diagram 8: Erosion Rate vs. Velocity
EROSION RATE VS. FLUID VELOCITY - LAB TEST DATA
(Inconel 625, 500 ppm sand concentration)

Erosion Rate (mm/year)
    ^
    |
10 +                                    *
    |                                 *
 8 +                               *
    |                            *
 6 +                         *
    |                      *
 4 +                   *
    |                *
 2 +             *
    |          *
 1 +       *                     E = K × V^n
    |    *                       n ≈ 2.4
 0.5+ *                           R² = 0.96
    |
    +----+----+----+----+----+----+----+ Velocity (m/s)
        2    4    6    8    10   12   14

CRITICAL VELOCITY (5 m/s):
+------------------------+
| SAFE ZONE: < 5 m/s     | → Erosion < 0.5 mm/year
| CAUTION: 5-10 m/s      | → Erosion 0.5-3 mm/year
| DANGER: > 10 m/s       | → Erosion > 3 mm/year
+------------------------+

FIELD RULE: If velocity > 8 m/s, you need:
- Rounded entry edges
- Hard coating (DLC/Carbide)
- Lower slot density
- Shorter inspection interval
Diagram 9: Temperature Effect on Slot Integrity
THERMAL EXPANSION EFFECT - SLOT DIMENSION CHANGE
(∆T from surface to reservoir = +100°C)

Original Slot: 0.30mm at 20°C (Surface)

Heating to 120°C (Reservoir):
+------------------+
|                  |
|   [   0.30mm  ]  |  Steel expands: α = 12e-6 /°C
|                  |  ∆L = L × α × ∆T
|   [   0.31mm  ]  |  ∆L = 50mm × 12e-6 × 100
|                  |  ∆L = 0.06mm (length only)
|   [   0.30mm  ]  |
|                  |  Width unchanged (constrained)
+------------------+

Cooling during stimulation (Fracturing, 0°C fluid):
+------------------+
|                  |
|   [   0.30mm  ]  |  Thermal shock: -120°C ∆T
|                  |  Stress = E × α × ∆T
|   [   0.29mm  ]  |  Stress = 200GPa × 12e-6 × 120
|                  |  Stress = 288 MPa
|   [   0.29mm  ]  |
|                  |  → Approaching yield (L-80: 552 MPa)
+------------------+

WARNING: Multiple thermal cycles can fatigue slot edges
→ Micro-cracks initiate → Erosion accelerates
Diagram 10: Slot Inspection Decision Tree
FIELD INSPECTION DECISION TREE
(Pulled liner evaluation - What I actually use)

                      START HERE
                          |
                          v
              Visual inspection of slots
                          |
              +-----------+-----------+
              |                       |
         Clean slots?            Plugged slots?
              |                       |
              v                       v
    Measure slot width       Attempt cleaning
              |                 (sonic/chemical)
              |                       |
    +---------+---------+       +------+------+
    |         |         |       |             |
 <10%     10-25%    >25%    Cleaned?     Still plugged?
 erosion  erosion  erosion     |             |
    |         |         |       v             v
    v         v         v    Measure      DISCARD
   OK    Monitor   FAIL    width          section
          closely           |
                            v
                      Compare to original
                            |
              +-------------+-------------+
              |             |             |
           <10%         10-25%        >25%
           OK           Monitor       FAIL
                        closely

FINAL DISPOSITION:
+--------------------------------+
| If erosion > 25% → SCRAP       |
| If erosion 10-25% → Redesign   |
| If erosion < 10% → Re-run      |
+--------------------------------+
Diagram 11: Flow Regime Impact on Erosion Pattern
EROSION PATTERNS BY FLOW REGIME
(Microscope photos - Cooper Basin failure, 2018)

RADIAL FLOW (90° entry):     MIXED FLOW (45-60° entry):
+------------------+         +------------------+
|   Slot Center    |         |  Upstream Edge   |
|                  |         |                  |
|   [    ERODED  ] |         | [ERODED]    [   ]|
|   [  ERODED    ] |         | [ERODED]    [   ]|
|   [    ERODED  ] |         | [ERODED]    [   ]|
|                  |         |                  |
|   Symmetrical    |         |  Asymmetrical    |
|   wear pattern   |         |  "Scalloped"     |
+------------------+         +------------------+

TANGENTIAL FLOW (<30° entry):  ACTUAL FAILURE (Cooper):
+------------------+         +------------------+
|  Entire Face     |         |                  |
|                  |         |  [    ]  [    ]  |
| [ERODED] [ERODED]|         |  [    ]  [    ]  |
| [ERODED] [ERODED]|         |  [xxxx]  [xxxx]  |
| [ERODED] [ERODED]|         |  [xxxx]  [xxxx]  |
|                  |         |  [    ]  [    ]  |
|  Uniform face    |         |  Upstream only   |
|  erosion         |         |  (What we saw)   |
+------------------+         +------------------+

ROOT CAUSE: Helical flow in wellbore
→ Sand grains hit upstream edge at angle
→ One-sided erosion → Slot widening → Sand production
Diagram 12: Slot Manufacturing Quality Control
SLOT QUALITY CONTROL CHART
(What I check before accepting any liner)

PARAMETER         |  ACCEPTABLE  |  REJECT     | FIELD CHECK METHOD
------------------+--------------+-------------+-------------------
Width tolerance   |  ±0.02mm     |  > ±0.05mm  | Pin gauges, 5 slots/m
Length tolerance  |  ±0.5mm      |  > ±1.0mm   | Caliper, visual
Edge radius       |  >0.03mm     |  <0.01mm    | Microscope, 10x
Burr height       |  <0.02mm     |  >0.05mm    | Finger test, feeler
Surface finish    |  Ra < 3.2μm  |  Ra > 6.3μm | Comparators
Slot spacing      |  ±2%         |  > ±5%      | Template, measure
Pattern alignment|  ±1°         |  > ±3°      | Protractor, visual

VISUAL INSPECTION RECORD:
+--------------------------------------------------+
| Liner S/N:  L-80-12345      Date:  15-Mar-2026  |
|--------------------------------------------------|
| Section | Width | Radius | Burr | Pass/Fail | Initials |
|---------+-------+--------+------+-----------+----------|
| 1 (heel)| 0.31  | 0.04   | 0.01 | PASS      |  JD     |
| 2       | 0.30  | 0.03   | 0.02 | PASS      |  JD     |
| 3       | 0.32  | 0.02   | 0.03 | PASS      |  JD     |
| 4       | 0.30  | 0.04   | 0.01 | PASS      |  JD     |
| 5       | 0.35  | 0.01   | 0.04 | FAIL      |  JD     |
| 6 (toe) | 0.31  | 0.03   | 0.02 | PASS      |  JD     |
+--------------------------------------------------+

ACTION: Section 5 rejected - width 0.35mm (>0.33mm limit)
        Edge radius 0.01mm (sharp) - will erode
        Manufacturer notified - credit issued
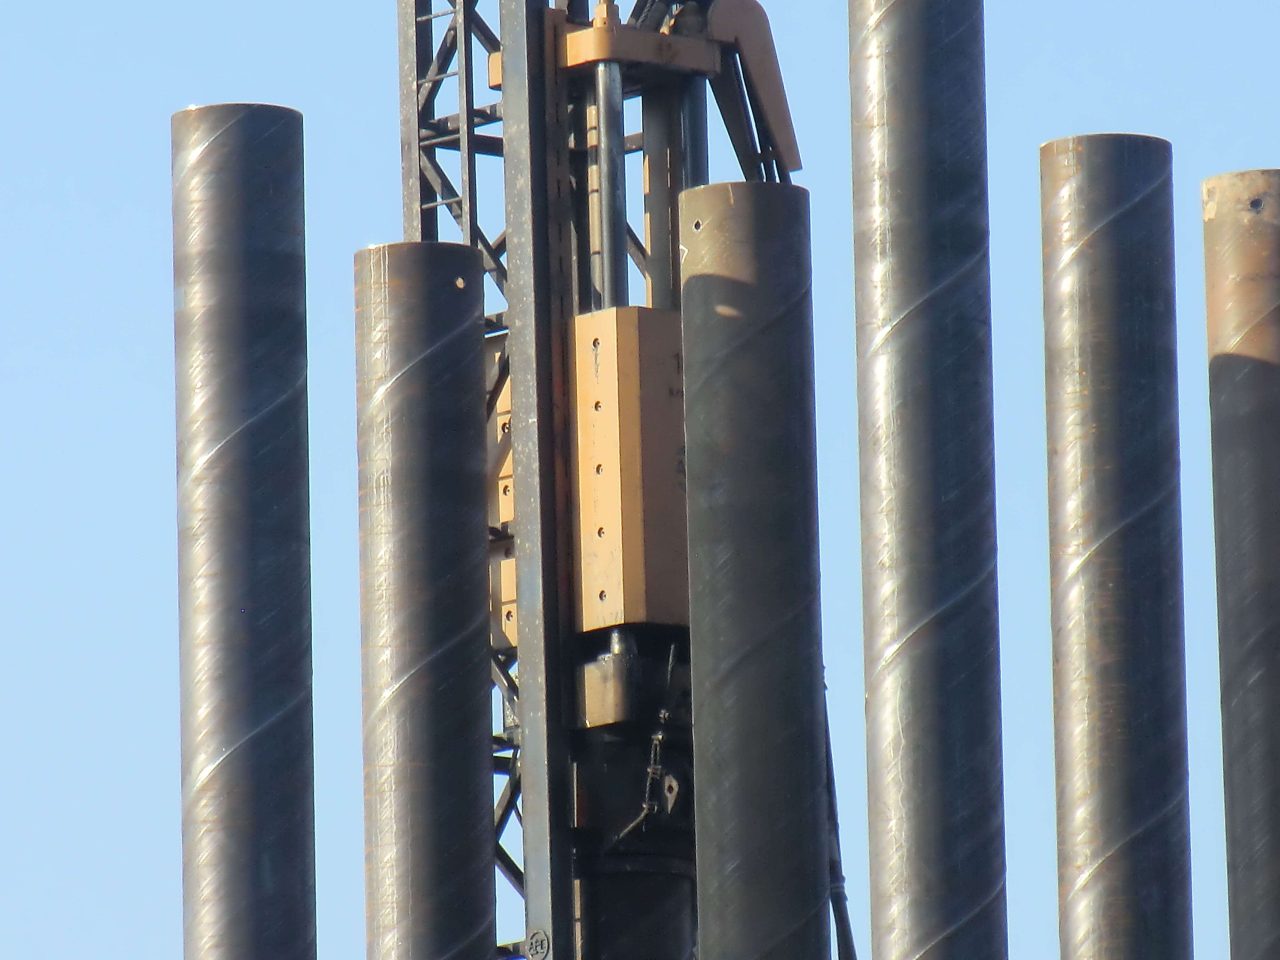
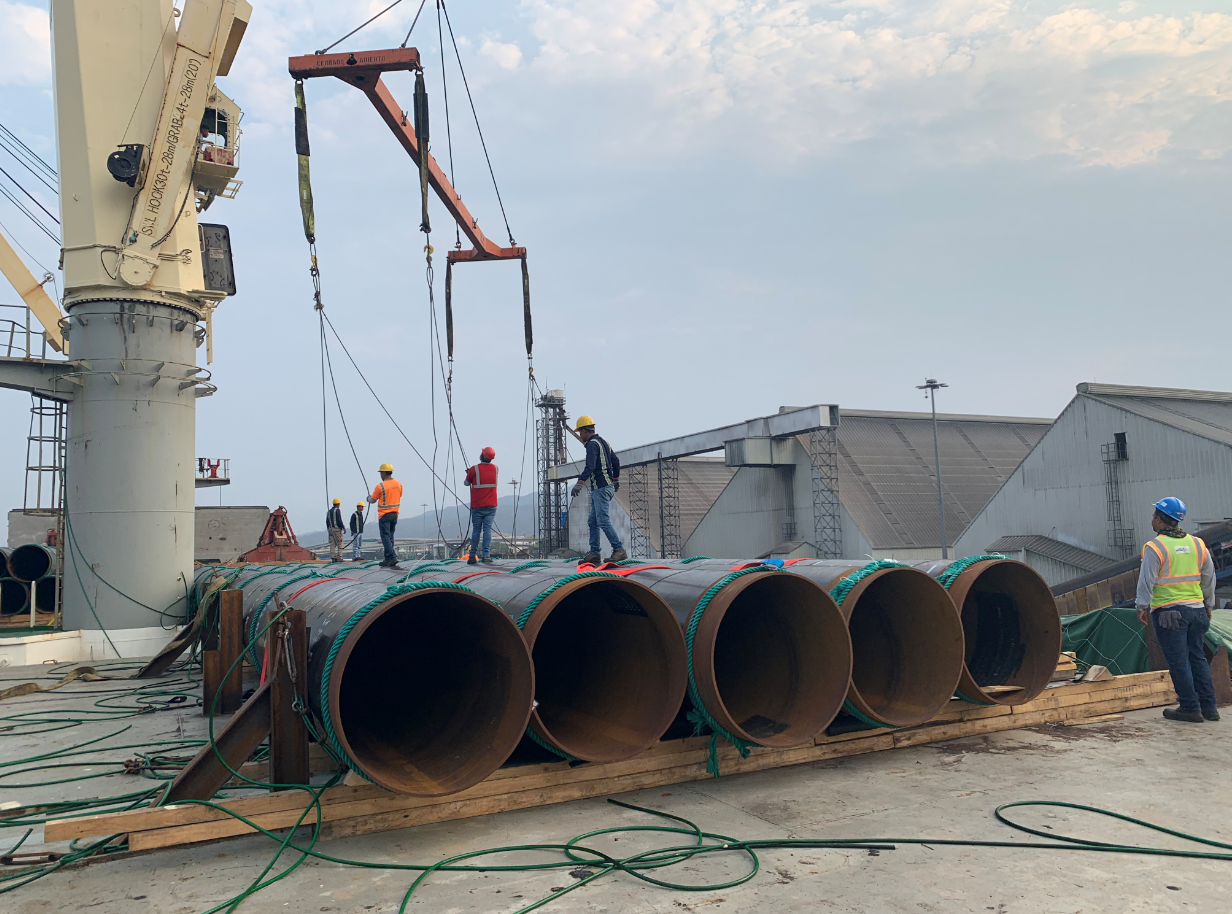
The use of pipe piles in foundation construction has been a popular choice for many years. Pipe piles are used to transfer the load of a structure to a deeper, more stable layer of soil or rock.
Benefits of Pipe Trusses The use of pipe trusses in construction offers several notable advantages: Strength and Load-bearing Capacity: Pipe trusses are renowned for their high strength-to-weight ratio. The interconnected pipes distribute loads evenly, resulting in a sturdy and reliable structure. This allows for the construction of large spans without the need for excessive support columns or beams.
The standard for fluid-conveying seamless pipes depends on the country or region you are in, as well as the specific application. However, some widely used international standards for fluid-conveying seamless pipes are: ASTM A106: This is a standard specification for seamless carbon steel pipes for high-temperature service in the United States. It is commonly used in power plants, refineries, and other industrial applications where high temperatures and pressures are present. It covers pipes in grades A, B, and C, with varying mechanical properties depending on the grade. API 5L: This is a standard specification for line pipes used in the oil and gas industry. It covers seamless and welded steel pipes for pipeline transportation systems, including pipes for conveying gas, water, and oil. API 5L pipes are available in various grades, such as X42, X52, X60, and X65, depending on the material properties and application requirements. ASTM A53: This is a standard specification for seamless and welded black and hot-dipped galvanized steel pipes used in various industries, including fluid-conveying applications. It covers pipes in two grades, A and B, with different mechanical properties and intended uses. DIN 2448 / EN 10216: These are European standards for seamless steel pipes used in fluid-conveying applications, including water, gas, and other fluids. Read more
Fluid-conveying seamless pipes are designed to resist various types of corrosion depending on the material used and the specific application. Some of the most common types of corrosion that these pipes are designed to resist include: Uniform corrosion: This is the most common type of corrosion, where the entire surface of the pipe corrodes uniformly. To resist this type of corrosion, pipes are often made of corrosion-resistant materials, such as stainless steel or lined with protective coatings. Galvanic corrosion: This occurs when two dissimilar metals are in contact with each other in the presence of an electrolyte, leading to the corrosion of the more active metal. To prevent galvanic corrosion, pipes can be made of similar metals, or they can be isolated from each other using insulating materials or coatings. Pitting corrosion: Pitting is a localized form of corrosion that occurs when small areas on the pipe's surface become more susceptible to attack, leading to the formation of small pits. This type of corrosion can be prevented by using materials with high pitting resistance, such as stainless steel alloys with added molybdenum, or by applying protective coatings. Crevice corrosion: Crevice corrosion occurs in narrow spaces or gaps between two surfaces, such Read more

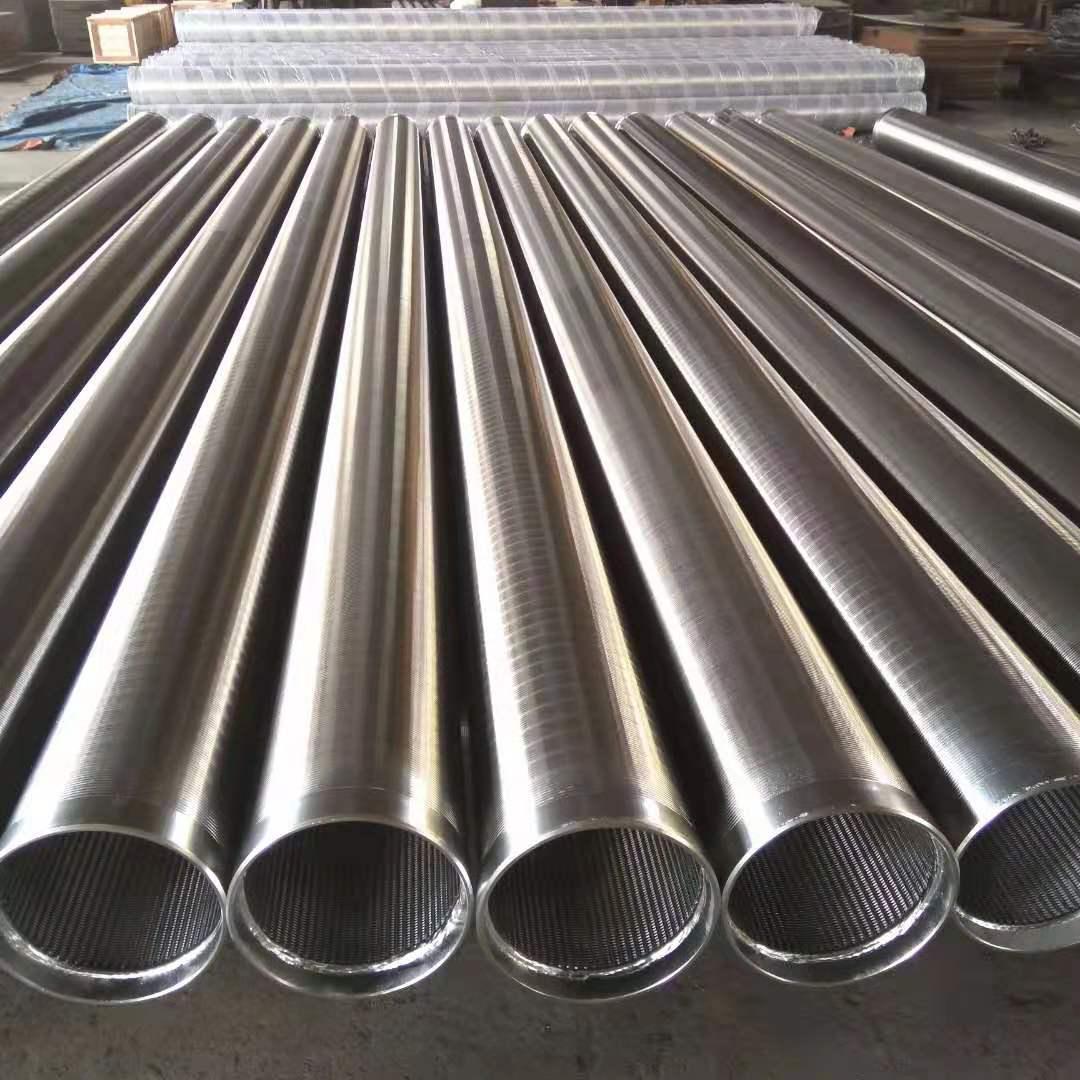
Wedge wire screens, also known as profile wire screens, are commonly used in various industries for their superior screening capabilities. They are constructed from triangular-shaped wire,
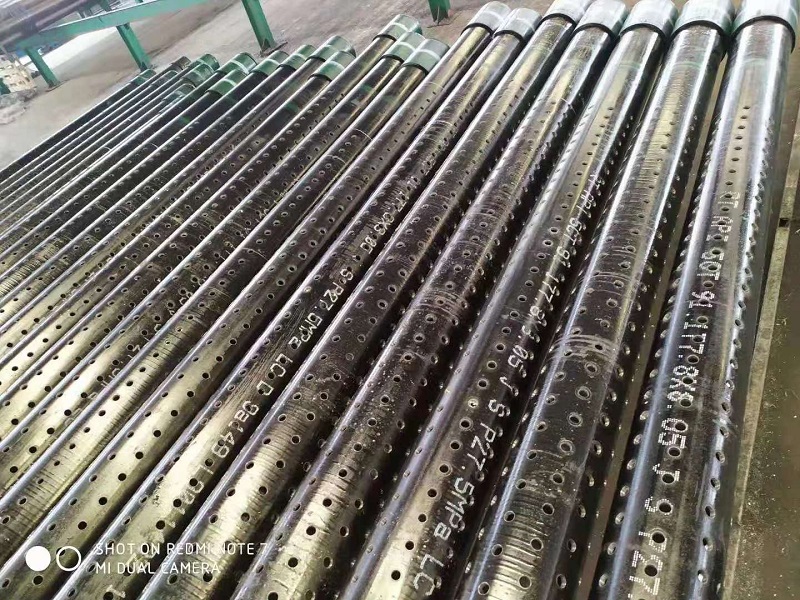
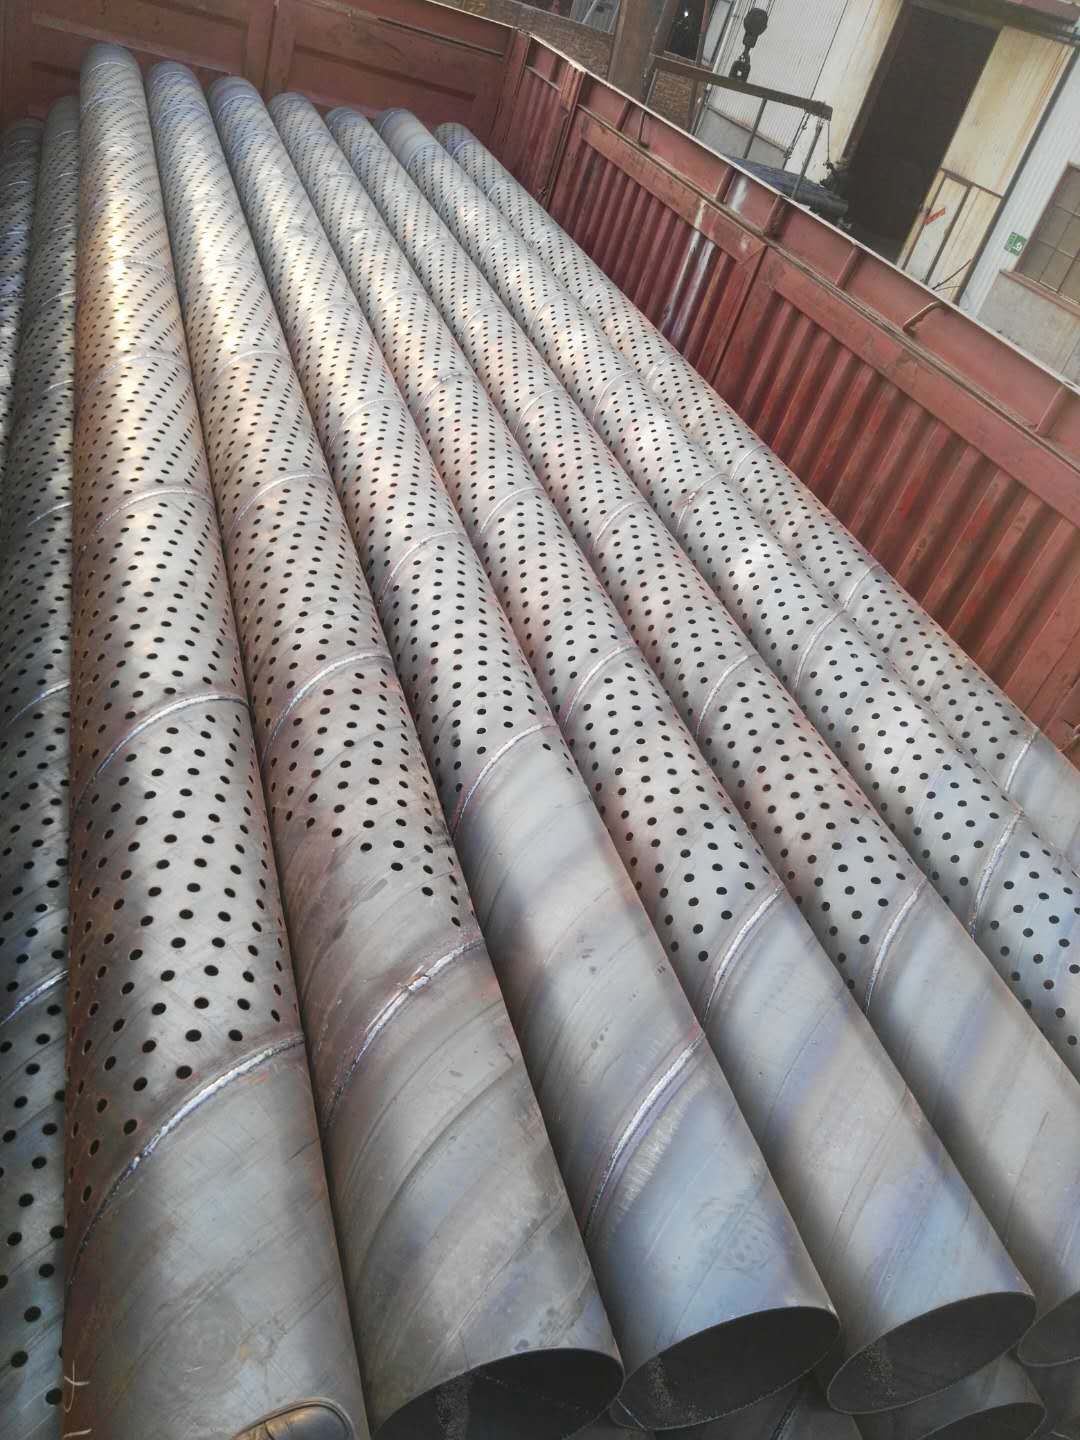
2 7/8in J55 K55 Perforated Well Casing Pipe is one of mainly products of we abter steel, they can be used for water, oil, gas well drilling fields. The thicknesss can be supplied from 5.51-11.18mm based on client's well depth and required mechanical properties. Normally they are provided with thread connection, like NUE or EUE, which will be easier to installed at site. The length of 3-12m perforated casing pipes are available for client's different drilling rigs height. The hole diameter and open area on the surface are also customized. The popular hole diameters are 9mm, 12mm, 15mm, 16mm, 19mm, etc.
